
")
")


The energy situation in the first eight months of 2015 and outlook for 2015
The energy situation in the first eight months of 2015
Thailand’s economic forecast 2015 by the Office of Economic and Social Development Board (NESDB.) point out that Thailand's economy is expanding in the range of 2.7 to 3.2 percent due to the acceleration of government spending and investment and the implementation of public investment. The oil prices and inflation are likely to remain low, it will help increase the real purchasing power of the people. However, the slowdown of the global economy, especially China, and the Ratchaprasong Explosion on August 17, 2015 that could affect the confidence of tourists there are also risks to the growth of Thai’s economy. It is expected that the average Dubai crude oil price in 2015 is in the range of 40.0 to 45.0 US dollars per barrel.
During the first eight months of 2015, the primary energy consumption is expected to be 2,603 thousand barrels of oil equivalent per day, increase from the same period in 2014 by 2.4 percent. Oil consumption is expected to increase by 4.0 percent as oil prices are likely to decrease. The natural gas consumption is expected to increase by 1.9 percent due to the increasing of power generation by Independent Power Producers (IPP) and Small Power Producer (SPP). The coal consumption is expected to increase by 4.0 percent due to their used in industry for the replacement of lignite that was decreased by constraints of volume production of lignite in the country. The consumption of lignite is expected to fall 21.6 percent compared to the same period last year. This is because of the shutdown for maintenance of lignite power plant and the reducing in electricity production of the Mae Moh power plant to make the transmission system more capacity for the synchronize testing of Hongsa power plant. The hydropower and electricity imports consumption are expected to decline 19.2 percent due to low rainfall over the past few years. This cause the amount of water used to produce electricity to be low. The renewable energy consumption is expected to rise 7.3 percent.
Primary Energy Consumption
Unit: kilo barrels of oil equivalent per day
|
|||||||||||||||||||||||||||||||||||||||||||||||||||||||||||||||||||||||||||||||||||||||||||||||||||||||||||
Remark/Pestimated from data as of August 2015
In the first eight months of 2015, the petroleum products consumption increased 2.2 percent. The demand of gasoline rose 13.3 percent due to the decrease of domestic gasoline retail price which was affected by the decline in oil prices in the world market. The expansions of the tourism sector make diesel and jet fuel consumption increased by 3.3 and 9.1 percent respectively. Use of fuel oil dropped 6.6 percent.
The LPG consumption in the first eight months of 2015 has decreased by 7.7 percent due to lower demand in transport, Household and petrochemical sector. LPG consumption in transportation sector have decreased 9.5 percent due to the increase of LPG prices, as oil prices fell, some customers turn to petroleum oil instead of LPG. In the household sector, The LPG consumption have decreased by 4.8 percent and steadily declined since the start of stringent measures to suppress the illegal distribution of LPG. While the industrial sector has increased LPG demand by 4.7 percent.
Petroleum Products Consumption
Unit: million liters
|
Year |
2011 | 2012 | 2013 | 2014 | Jan.-Sep.P | |
| 2014 | 2015 | |||||
| Consumption | 46,867 | 49,455 | 50,786 | 51,124 | 34,022 | 34,766 |
| Gasoline | 7,331 | 7,705 | 8,195 | 8,506 | 5,550 | 6,291 |
| Diesel | 19,206 | 20,579 | 20,907 | 21,084 | 14,182 | 14,657 |
| Kerosene + Jet Fuel | 5,090 | 5,105 | 5,573 | 5,524 | 3,660 | 3,994 |
| Fuel Oil | 2,482 | 2,389 | 2,175 | 2,093 | 1,433 | 1,338 |
| LPG | 12,759 | 13,678 | 13,935 | 13,917 | 9,196 | 8,487 |
| Changing Rate(%yoy) | 5.6 | 5.5 | 2.7 | 0.7 | -0.01 | 2.2 |
| Gasoline | -1.2 | 5.1 | 6.4 | 3.8 | 1.1 | 13.3 |
| Diesel | 3.8 | 7.1 | 1.6 | 0.8 | 0.3 | 3.3 |
| Kerosene + Jet Fuel | 7.7 | 0.3 | 9.2 | -0.9 | -0.1 | 9.1 |
| Fuel Oil | -6.2 | -3.7 | -8.9 | -3.8 | -3.8 | -6.6 |
| LPG | 15.1 | 7.2 | 1.9 | -0.1 | -0.5 | -7.7 |
Remark/Pestimated from data as of August 2015
Fuel consumption for land transport
In the first eight months of 2015, the fuel consumption in land transport sector stood at 14,656 kilo tons of oil equivalent (ktoe) increase over the same period of the previous year by 4.3 percent. It is caused by an increase in the use of gasoline and diesel. The diesel (Holds up to 46 percent of energy use in all sectors of land transport) has increased by 3.3 percent compared to the same period last year.While the uses of LPG and NGV in the car (9 and 13vpercent, respectively) are down 9.6 and 1.3 percent, respectively, this is a major cause of the decline in prices. Gasoline and diesel steadily since mid-2014, and the price hike of LPG and NGV in 2014 for restructuring policies to reflect the true cost of government. The limitations of NGV service stations that still is not enough to make the use of LPG and NGV partial return to the oil.
In the first eight months of 2015, the average retail price of LPG and NGV is at 23.92 and 12.94 baht per kilogram), up 2.54 and 2.44 baht per kilogram, respectively, compare to the same period last year. While the cumulative NGV car is at 470,565, increase 3.5 percent, in August 2015. The NGV service stations at the end of August 2015 totaling 499 stations, up from the previous year, only 3 stations.
The Board of Energy Policy Administration on September 8, 2015 approved retail price of LPG and NGV at 22.29 and 13.50 baht per kilogram, respectively
The Energy Consumption in Land Transportation Sector
unit : ktoe
|
year |
2013 |
2014 |
2015 | Changing(%) | |||
| (Jan.–Sep.P) | Share(%) | 2013 | 2014 |
2015 (Jan.-Sep.P) |
|||
| Gasoline | 6,106 | 6,338 | 4,687 | 32 | 6.4 | 3.8 | 13.3 |
| Diesel | 10,719 | 9,670 | 6,722 | 46 | -14.1 | -9.8 | 3.3 |
| LPG | 2,071 | 2,304 | 1,382 | 9 | 67.3 | 11.2 | -9.6 |
| NGV | 2,753 | 2,839 | 1,866 | 13 | 33.1 | 3.1 | -1.3 |
| Total | 21,649 | 21,150 | 14,656 | 100 | 0.6 | -2.3 | 4.3 |
Remark /Pestimated from data as of August 2015
The production and consumption of electricity during the first eight months of 2015
FT during May - August 2015 stood at 49.61 satang per unit, will be down 3.23 satang per unit in the September - December 2015 due to the drop of fuel prices in the world market, and the depreciate of exchange rate in the past.
The electricity consumption during the first eight months in 2015is approximated 116,350 gigawatt hours. It is increased 3.4 percent due to the hot weather in the summer and rainfall slower than last year. The electricity utilization increased in almost all sectors except agriculture.
The tariff formulated by automatically tariff adjustment formula (Ft).
Unit: Satang/unit
| Monthly charge | Ft(Retail Price) | Changing |
| Jan. 2014–Apr. 2014 | 59.00 | 5.00 |
| May 2014-Aug. 2014 | 69.00 | 10.00 |
| Sep. 2014-Dec. 2014 | 69.00 | 0.00 |
| Jan. 2015–Apr. 2015 | 58.96 | -10.04 |
| May 2015-Aug. 2015 | 49.61 | -9.35 |
| Sep. 2015–Oct. 2015 | 46.38 | -3.23 |
Price and value of Energy Import
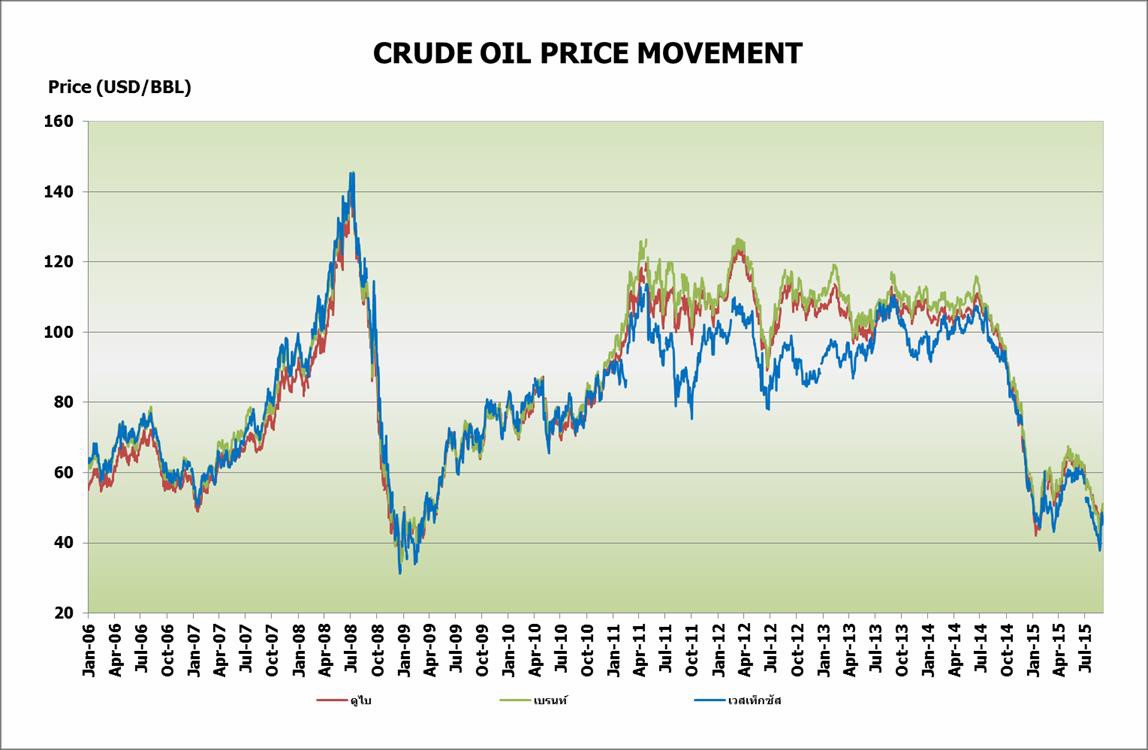
Crude oil prices (The average price of Dubai and West Texas) during August 2015 stood at US $ $47.69 and $42.77a barrel, down $8.47 and $8.12US dollars per barrel, respectively, compared to the average price in July 2015 due to the concerns over supply condition.
The price of gasoline and diesel fuel (average price in Singapore market) during August 2015 is at $65.98 and $57.04, down $9.97 and $8.04 per barrel compared to the average price in the previous month.
The total energy imported value during the first 8 months of 2015 was estimated at 654 billion baht, down 33.3 percent compared to the same period in 2014 due to a decrease in the price of imported energy. The import value of each type of energy is reduction. Except natural gas and liquefied natural gas (LNG) imports are increasing as the volume of imports. The value of imports increased by 11.7and 8.6 percent, respectively. The value of crude oil imported fell 36.7 percent according to crude oil price in the world market. The reduction of coal prices in the world market make the coal imported value fell by 5.9 percent compared to the same period last year. The value of imported petroleum products is down 53.8 percent due to the reduction of petroleum products volume and prices. The electricity imported value decreased 8.0 % by the reduction of imported volume.
Energy Imported Value
Unit: billion Baht
|
Imported Value |
Jan. – Aug.P | 2015(Jan. – Aug.) | ||
| 2014 | 20158 | Changing(%) | Share(%) | |
| Oil | 683 | 432 | -36.7 | 66 |
| Petroleum Products | 153 | 71 | -53.8 | 11 |
| Natural Gas | 70 | 78 | 11.7 | 12 |
| Coal | 33 | 31 | -5.9 | 5 |
| Electricity | 13 | 12 | -8.0 | 2 |
| LNG | 28 | 30 | 8.6 | 5 |
| Total | 980 | 654 | -33.3 | 100 |
Remark /P estimated from data as of August 2015
Energy Forecast and Information Technology Center
Energy Policy and Planning Office
October 28, 2015