")
")


Super User
Saturday, 08 October 2016 14:41
การเปลี่ยนแปลงราคาน้ำมัน 8 ตุลาคม 2559
Published in
ราคาขายปลีกน้ำมัน
Tagged under
Saturday, 01 October 2016 14:37
การเปลี่ยนแปลงราคาน้ำมัน 1 ตุลาคม 2559
Published in
ราคาขายปลีกน้ำมัน
Tagged under
Thursday, 06 October 2016 15:16
รายงานผลการประชุม กบง. วันที่ 5 ตุลาคม 2559
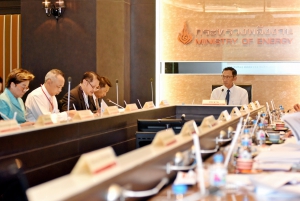
รายงานผลการประชุมคณะกรรมการบริหารนโยบายพลังงาน (กบง.)วันที่ 5 ตุลาคม 2559
Published in
ข่าว สนพ.
Tagged under
Friday, 30 September 2016 13:51
สถานการณ์ภาพรวมพลังงานรายเดือน กรกฎาคม ปี 2559
Published in
รายเดือน
Tagged under
Wednesday, 28 September 2016 18:40
สถานการณ์การใช้น้ำมันและไฟฟ้ารายเดือน กรกฎาคม ปี 2559
Published in
สถานการณ์การใช้น้ำมันและไฟฟ้า
Tagged under
Saturday, 17 September 2016 17:42
การเปลี่ยนแปลงราคาน้ำมัน 17 กันยายน 2559
Published in
ราคาขายปลีกน้ำมัน
Tagged under
Tuesday, 13 September 2016 17:36
การเปลี่ยนแปลงราคาน้ำมัน 13 กันยายน 2559
Published in
ราคาขายปลีกน้ำมัน
Tagged under
Wednesday, 28 September 2016 16:08
สนพเผยสถานการณ์การใช้พลังงาน 9 เดือน ปี 59

สนพ. เผยสถานการณ์การใช้พลังงาน 9 เดือน ปี 59 โตขึ้นร้อยละ 1.1 ตาม GDP ของประเทศ เผยไฟฟ้า เพิ่มร้อยละ 4.9 น้ำมันเพิ่มร้อยละ 4.8
Published in
ข่าว สนพ.
Tagged under